
RESEARCH & DATA
U.S. Passport Statistics (2026): 75 Verified Facts and Figures
How many Americans have a passport, how many are issued each year and in each state, what they cost and how long they take. Every figure is linked to its original source and was checked twice, including an independent review.
Last updated: November 15, 2026
HOW MANY AMERICANS HAVE A PASSPORT?
48%
of Americans had a passport in 2024, up from 5% in 1990, according to the State Department. There were 183.2 million valid U.S. passports (books and cards) in circulation in 2025.
Sources: Congressional Research Service and U.S. Department of State.
Key statistics
- The State Department reports that 48% of Americans had a passport in 2024, up from 5% in 1990.
- There were 183,170,240 valid U.S. passports (books and cards) in circulation in 2025, the most on record.
- The State Department issued 27,348,416 passports in fiscal year 2025, the most since its records begin in FY1996.
- FY2025 issuance included 4,544,022 passport cards and 22,804,394 passport books (books calculated).
- The State Department received 23,308,976 passport applications in FY2025, the most on record.
- California residents received 3,120,262 passports in FY2025, more than any other state.
- New Jersey had the fastest growth of any state (territories aside), with issuance up about 23.0% from 768,344 in FY2024 (calculated).
- Massachusetts residents received 582,684 passports in FY2025, up about 7.3% from 542,913 (calculated).
- 43% of U.S. adult citizens said they hold a current passport in an August 2023 YouGov survey, while 52% said they do not.
- 76% of Americans have visited at least one other country, including 26% who have been to five or more.
ON THIS PAGE
- How many Americans have a passport
- Passports issued each year
- Passport cards
- Applications
- Passports by state
- Fees and validity
- Processing and access
- Online renewal
- Who has a passport
- International travel
- Passports and your documents abroad
- Methodology
- Cite this page and download the data
- Frequently asked questions
How many Americans have a passport?
The State Department counts valid passports in circulation, not people. Because many Americans hold both a passport book and a passport card, the number of people with a passport is lower than the number of valid passports.
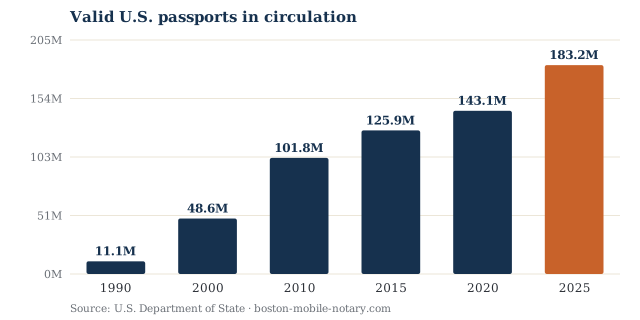
- There were 183,170,240 valid U.S. passports (books and cards) in circulation in 2025, the most on record. U.S. Department of State, Bureau of Consular Affairs#1
- The State Department reports that 48% of Americans had a passport in 2024, up from 5% in 1990. Congressional Research Service#2
- There are about 54 valid U.S. passports for every 100 U.S. residents (calculated from 183,170,240 valid passports and a population of 341.8 million); because many people hold both a book and a card, the share of people with a passport is lower. U.S. Department of State, Bureau of Consular Affairs#3
- The U.S. resident population was an estimated 341.8 million on July 1, 2025. U.S. Census Bureau (as reported by FOX/AP)#4
- Valid passports in circulation rose 7.8% in one year, from 169,915,821 in 2024 to 183,170,240 in 2025 (calculated). U.S. Department of State, Bureau of Consular Affairs#5
- Valid passports in circulation grew about 45.5% in a decade, from 125,907,176 in 2015 (calculated). U.S. Department of State, Bureau of Consular Affairs#6
- In 1989 there were just 7,261,711 valid U.S. passports; there are now about 25 times as many (calculated). U.S. Department of State, Bureau of Consular Affairs#7
- Valid U.S. passports in circulation reached 11,116,489 in 1990 and 48,614,417 in 2000. U.S. Department of State, Bureau of Consular Affairs#8
- Valid passports in circulation passed 100 million for the first time in 2010, at 101,797,872. U.S. Department of State, Bureau of Consular Affairs#9
Passports issued each year
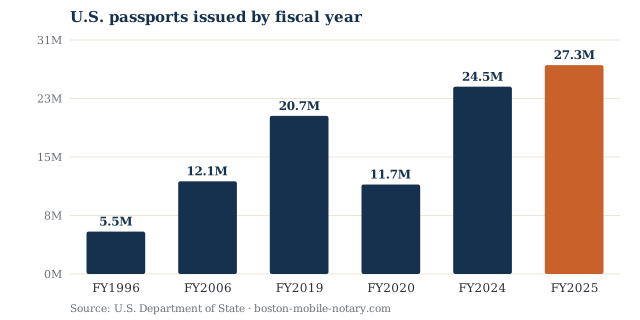
- The State Department issued 27,348,416 passports in fiscal year 2025, the most since its records begin in FY1996. U.S. Department of State, Bureau of Consular Affairs#10
- FY2025 issuance included 4,544,022 passport cards and 22,804,394 passport books (books calculated). U.S. Department of State, Bureau of Consular Affairs#11
- Passport issuance rose about 11.6% from 24,515,786 in FY2024 to 27,348,416 in FY2025 (calculated). U.S. Department of State, Bureau of Consular Affairs#12
- FY2024 issuance of 24,515,786 included 3,737,228 passport cards. U.S. Department of State, Bureau of Consular Affairs#13
- The State Department issued 24,021,257 passports in FY2023 and 21,995,760 in FY2022. U.S. Department of State, Bureau of Consular Affairs#14
- Issuance fell to 11,711,945 in pandemic-affected FY2020, down from 20,690,491 in FY2019. U.S. Department of State, Bureau of Consular Affairs#15
- FY2025 issuance was about 393% higher than the 5,547,693 passports issued in FY1996 (calculated). U.S. Department of State, Bureau of Consular Affairs#16
- Issuance jumped about 51.5% in a single year, from 12,133,537 in FY2006 to 18,382,798 in FY2007 (calculated). U.S. Department of State, Bureau of Consular Affairs#17
- Annual issuance first passed 20 million in FY2017, at 21,378,994. U.S. Department of State, Bureau of Consular Affairs#18
Passport cards
- Passport cards first appear in the State Department's data in FY2008, with 189,560 issued. U.S. Department of State, Bureau of Consular Affairs#19
- Passport card issuance grew about 21.6% in one year, from 3,737,228 in FY2024 to 4,544,022 in FY2025 (calculated). U.S. Department of State, Bureau of Consular Affairs#20
- Passport cards made up about 16.6% of all passports issued in FY2025 (calculated). U.S. Department of State, Bureau of Consular Affairs#21
- Many applicants request a passport book and card at the same time; in FY2025, the 27,348,416 passports issued exceeded the 23,308,976 applications received. U.S. Department of State, Bureau of Consular Affairs#22
Passport applications
- The State Department received 23,308,976 passport applications in FY2025, the most on record. U.S. Department of State, Bureau of Consular Affairs#23
- Passport applications rose about 14.1% from 20,437,207 in FY2024 (calculated). U.S. Department of State, Bureau of Consular Affairs#24
- Applications fell to 11,533,128 in FY2020, from 18,578,593 in FY2019. U.S. Department of State, Bureau of Consular Affairs#25
- The fewest applications in the State Department's series were 3,124,527 in 1991. U.S. Department of State, Bureau of Consular Affairs#26
- The State Department received 4,114,532 passport applications in 1986, the first year in its published series. U.S. Department of State, Bureau of Consular Affairs#27
- The State Department projects 10,509,576 adult passport renewal (Form DS-82) applicants in FY2027. U.S. Department of State (Federal Register)#28
Passports issued by state
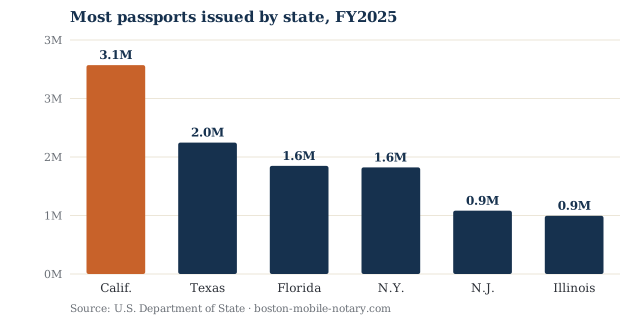
- California residents received 3,120,262 passports in FY2025, more than any other state. U.S. Department of State, Bureau of Consular Affairs#29
- Texas (1,962,631), Florida (1,613,834) and New York (1,592,643) followed California in FY2025 passport issuance. U.S. Department of State, Bureau of Consular Affairs#30
- California, Texas, Florida and New York together accounted for about 30.3% of all passports issued in FY2025 (calculated). U.S. Department of State, Bureau of Consular Affairs#31
- New Jersey residents received 944,922 passports in FY2025, the fifth most of any state. U.S. Department of State, Bureau of Consular Affairs#32
- Illinois (869,928), Pennsylvania (806,982), North Carolina (682,057), Georgia (654,190) and Washington (647,710) round out the top 10 states for FY2025 issuance. U.S. Department of State, Bureau of Consular Affairs#33
- New Jersey had the fastest growth of any state (territories aside), with issuance up about 23.0% from 768,344 in FY2024 (calculated). U.S. Department of State, Bureau of Consular Affairs#34
- Washington (up about 21.1%), Minnesota (about 20.7%) and Alabama (about 19.8%) also posted some of the largest increases in FY2025 (calculated). U.S. Department of State, Bureau of Consular Affairs#35
- Massachusetts residents received 582,684 passports in FY2025, up about 7.3% from 542,913 (calculated). U.S. Department of State, Bureau of Consular Affairs#36
- Wyoming residents received 30,301 passports in FY2025, the fewest of any state. U.S. Department of State, Bureau of Consular Affairs#37
- North Dakota (43,195), Vermont (43,331) and South Dakota (44,635) also had among the fewest passports issued in FY2025. U.S. Department of State, Bureau of Consular Affairs#38
- Washington, D.C., residents received 226,438 passports in FY2025, down about 8.6% from 247,623 (calculated). U.S. Department of State, Bureau of Consular Affairs#39
- Only three jurisdictions saw passport issuance fall in FY2025: the District of Columbia, Guam and Hawaii (calculated). U.S. Department of State, Bureau of Consular Affairs#40
- Puerto Rico residents received 207,115 passports in FY2025, up about 20.4% (calculated). U.S. Department of State, Bureau of Consular Affairs#41
- The state and territory rows in the State Department's table add up to 22,647,195 passports in FY2025, fewer than the national total of 27,348,416 (calculated). U.S. Department of State, Bureau of Consular Affairs#42
All states and territories, FY2025
| Rank | State or territory | FY2025 | FY2024 | Change |
|---|---|---|---|---|
| 1 | California | 3,120,262 | 2,836,428 | +10.0% |
| 2 | Texas | 1,962,631 | 1,843,673 | +6.5% |
| 3 | Florida | 1,613,834 | 1,534,682 | +5.2% |
| 4 | New York | 1,592,643 | 1,455,210 | +9.4% |
| 5 | New Jersey | 944,922 | 768,344 | +23.0% |
| 6 | Illinois | 869,928 | 753,679 | +15.4% |
| 7 | Pennsylvania | 806,982 | 709,627 | +13.7% |
| 8 | North Carolina | 682,057 | 589,941 | +15.6% |
| 9 | Georgia | 654,190 | 604,760 | +8.2% |
| 10 | Washington | 647,710 | 534,931 | +21.1% |
| 11 | Virginia | 626,041 | 586,507 | +6.7% |
| 12 | Ohio | 591,125 | 538,854 | +9.7% |
| 13 | Massachusetts | 582,684 | 542,913 | +7.3% |
| 14 | Michigan | 519,365 | 473,084 | +9.8% |
| 15 | Maryland | 467,547 | 439,651 | +6.3% |
| 16 | Arizona | 464,479 | 405,869 | +14.4% |
| 17 | Colorado | 448,664 | 418,999 | +7.1% |
| 18 | Minnesota | 447,450 | 370,637 | +20.7% |
| 19 | Tennessee | 379,800 | 322,865 | +17.6% |
| 20 | Wisconsin | 337,651 | 309,505 | +9.1% |
| 21 | Indiana | 328,625 | 299,338 | +9.8% |
| 22 | Missouri | 310,131 | 280,253 | +10.7% |
| 23 | Oregon | 293,768 | 253,124 | +16.1% |
| 24 | South Carolina | 287,280 | 261,114 | +10.0% |
| 25 | Connecticut | 283,788 | 264,128 | +7.4% |
| 26 | Utah | 247,111 | 232,283 | +6.4% |
| 27 | District of Columbia | 226,438 | 247,623 | -8.6% |
| 28 | Alabama | 219,876 | 183,571 | +19.8% |
| 29 | Nevada | 217,126 | 195,854 | +10.9% |
| 30 | Puerto Rico | 207,115 | 171,995 | +20.4% |
| 31 | Louisiana | 192,230 | 171,303 | +12.2% |
| 32 | Kentucky | 191,401 | 166,021 | +15.3% |
| 33 | Oklahoma | 177,847 | 160,666 | +10.7% |
| 34 | Iowa | 167,271 | 154,433 | +8.3% |
| 35 | Kansas | 156,496 | 142,810 | +9.6% |
| 36 | Idaho | 123,676 | 111,054 | +11.4% |
| 37 | Arkansas | 123,576 | 111,174 | +11.2% |
| 38 | Nebraska | 111,270 | 101,254 | +9.9% |
| 39 | Hawaii | 109,652 | 111,044 | -1.3% |
| 40 | New Hampshire | 105,262 | 96,132 | +9.5% |
| 41 | New Mexico | 102,393 | 91,543 | +11.9% |
| 42 | Maine | 97,121 | 81,725 | +18.8% |
| 43 | Mississippi | 90,513 | 85,811 | +5.5% |
| 44 | Rhode Island | 80,622 | 75,227 | +7.2% |
| 45 | Montana | 73,814 | 62,399 | +18.3% |
| 46 | Delaware | 66,314 | 61,452 | +7.9% |
| 47 | Alaska | 52,586 | 47,045 | +11.8% |
| 48 | West Virginia | 51,737 | 48,191 | +7.4% |
| 49 | South Dakota | 44,635 | 42,893 | +4.1% |
| 50 | Vermont | 43,331 | 40,059 | +8.2% |
| 51 | North Dakota | 43,195 | 42,295 | +2.1% |
| 52 | Wyoming | 30,301 | 28,510 | +6.3% |
| 53 | Guam | 14,249 | 15,353 | -7.2% |
| 54 | Virgin Islands | 9,234 | 8,328 | +10.9% |
| 55 | Northern Marianas | 3,997 | 3,444 | +16.1% |
| 56 | American Samoa | 3,249 | 1,738 | +86.9% |
Passports issued to residents of each state and territory. Source: U.S. Department of State, Bureau of Consular Affairs. Changes calculated by BMNAS. Many residents hold both a book and a card. Download this table (CSV).
Passport fees and validity
| Item | State Department fee | Acceptance facility fee |
|---|---|---|
| Adult passport book (first-time) | $130 | $35 |
| Adult passport card (first-time) | $30 | $35 |
| Adult book and card renewal | $160 | — |
| Child passport book (under 16) | $100 | $35 |
| Child passport card | $15 | $35 |
| Expedited service | +$60 | — |
| 1–2 day return delivery (books) | +$22.05 | — |
Source: U.S. Department of State, Passport Fees.
- An adult passport book costs $130 in State Department fees plus a $35 acceptance facility fee for first-time applicants. U.S. Department of State#43
- An adult passport card costs $30 plus a $35 acceptance facility fee for first-time applicants; renewing a book and card together costs $160. U.S. Department of State#44
- A child's passport book costs $100 and a child's passport card $15, each plus a $35 acceptance facility fee. U.S. Department of State#45
- Expedited service costs an extra $60, and 1–2 day return delivery costs $22.05. U.S. Department of State#46
- A search of passport records issued before 1994 costs $150. U.S. Department of State#47
- Adult passports are valid for 10 years, while passports for children under 16 are valid for five years. U.S. Department of State, Bureau of Consular Affairs#48
Processing times and where to apply
- Routine passport processing takes 4–6 weeks and expedited processing 2–3 weeks, according to the Congressional Research Service. Congressional Research Service#49
- By March 2023, routine processing times had risen to 10–13 weeks, up from six to nine weeks in January 2023. Congressional Research Service#50
- The State Department increased passport adjudication staffing by more than 32% from January 2022. Congressional Research Service#51
- The State Department operates 28 passport agencies and centers and plans six more. Congressional Research Service#52
- New passport agencies are planned in Cincinnati and Kansas City, then Salt Lake City, Orlando, Charlotte and San Antonio by 2028. Congressional Research Service#53
- The State Department has two passport print centers, in Hot Springs, Arkansas, and Tucson, Arizona. Congressional Research Service#54
- More than 7,400 passport acceptance facilities operate nationwide, including post offices, clerks of court and public libraries. Congressional Research Service#55
- The State Department says more than 99% of the U.S. population lives within 20 miles of a passport acceptance location. U.S. Department of State (as reported by Newsweek)#56
- The State Department said nonprofit libraries found ineligible as passport acceptance facilities (notices began in 2025) made up less than 1% of its network. U.S. Department of State (as reported by Newsweek)#57
- The American Library Association estimated that about 1,400 mostly nonprofit public libraries, roughly 15% of U.S. public libraries, could lose passport acceptance status. American Library Association (as reported by Journal-News)#58
Online passport renewal
- Online passport renewal became fully available to the public in September 2024. Congressional Research Service#59
- Online renewal is open to adults 25 and older renewing a 10-year passport that expires within a year or expired less than five years ago, for routine service only. Congressional Research Service#60
- The State Department estimates that about 60% of adult renewal applicants will apply online. U.S. Department of State (Federal Register)#61
- Expanding online renewal to Americans overseas could add up to 220,000 online applicants in FY2027. U.S. Department of State (Federal Register)#62
Who has a passport
Surveys ask people directly whether they hold a valid passport. Their results vary with timing and question wording.
| Group | Hold a current U.S. passport |
|---|---|
| All U.S. adult citizens | 43% |
| Under 30 | 53% |
| 30–44 | 46% |
| 45–64 | 33% |
| 65 and older | 46% |
| High school or less | 24% |
| College degree | 64% |
| Postgraduate degree | 71% |
Source: YouGov survey, August 2–4, 2023, 1,000 U.S. adult citizens.
- 43% of U.S. adult citizens said they hold a current passport in an August 2023 YouGov survey, while 52% said they do not. YouGov#63
- 53% of adults under 30 held a current passport, compared with 33% of those aged 45–64. YouGov#64
- 71% of Americans with a postgraduate degree and 64% of college graduates held a current passport, compared with 24% of those with a high school education or less. YouGov#65
- 55% of Hispanic Americans held a current U.S. passport, compared with 42% of white and 34% of Black Americans. YouGov#66
- 20% of Hispanic Americans said they had ever held a passport from another country, compared with 13% of Black and 4% of white Americans. YouGov#67
- 16% of Americans had applied for a passport or renewal in the previous two years; a third of them said it took longer than expected. YouGov#68
- 4% of Americans said they had cancelled travel because of passport delays, and 7% said they had ever lost a passport. YouGov#69
- In an April 2021 survey, 37% of U.S. adult citizens had a valid passport, 20% had an expired one and 38% had never had one. YouGov / The Economist#70
- Passport ownership rose with income: 21% of those earning under $50,000 had a valid passport, compared with 64% of those earning over $100,000. YouGov / The Economist#71
- 45% of adults in Western states and 40% in the Northeast held valid passports, compared with 33% in the South and 35% in the Midwest. YouGov / The Economist#72
International travel
- 76% of Americans have visited at least one other country, including 26% who have been to five or more. Pew Research Center#73
- 23% of Americans have never left the United States, and half have visited one to four other countries. Pew Research Center#74
- Two-thirds of upper-income Americans have traveled to at least five countries, compared with 9% of lower-income Americans. Pew Research Center#75
Passports and your documents abroad
A U.S. passport proves identity and citizenship, but it is rarely the only document a trip, a move or a transaction abroad requires.
- Notarized passport copies. Banks, foreign agencies and courts often ask for a certified or notarized copy of a passport. A notarized copy can usually be apostilled for use in countries that belong to the Hague Apostille Convention. See our Massachusetts apostille services.
- Supporting documents. Visas, residence permits and second-citizenship applications usually require apostilled birth and marriage certificates, background checks or academic records, often with a certified translation. Countries outside the Convention generally require embassy legalization.
For the broader picture, see our Americans Moving Abroad Statistics and Dual Citizenship Statistics.
Methodology
Most figures on this page come directly from the U.S. Department of State's Bureau of Consular Affairs, which publishes passports issued, applications received and valid passports in circulation, along with issuance by state. Additional figures come from the Congressional Research Service, the Federal Register, the U.S. Census Bureau and nationally representative surveys by YouGov and Pew Research Center. Each figure was confirmed on its source page, then checked again in a separate review against the same sources. Figures we calculated ourselves are labeled as calculations.
The State Department reports passports by federal fiscal year, which runs from October 1 to September 30. Passport counts include both books and cards, and its state rows add up to fewer passports than the national total. We review this page every quarter and after each annual data release.
Cite this page and download the data
You are welcome to use these statistics, charts and data files under a Creative Commons Attribution 4.0 (CC BY 4.0) license: free to use, with a credit link to this page.
Citation
Boston Mobile Notary & Apostille Service. (2026, November). U.S. passport statistics (2026): 75 verified facts and figures. https://www.boston-mobile-notary.com/us-passport-statistics.html
Link
<a href="https://www.boston-mobile-notary.com/us-passport-statistics.html">U.S. Passport Statistics – Boston Mobile Notary & Apostille Service</a>
Download all 75 statistics with sources (CSV)
Download passports issued by state (CSV)
Each file includes the citation and links back to this page.
Frequently asked questions
How many Americans have a passport?
The State Department reports that 48% of Americans had a passport in 2024, up from 5% in 1990. There were 183,170,240 valid U.S. passports in circulation in 2025, but that count includes both passport books and passport cards, and many people hold one of each, so the number of people with a passport is lower.
How many passports does the U.S. issue each year?
The State Department issued a record 27,348,416 passports in fiscal year 2025, including 4,544,022 passport cards, up about 11.6% from 24,515,786 in FY2024.
Which state has the most passports?
California residents received 3,120,262 passports in FY2025, the most of any state, followed by Texas, Florida and New York. Wyoming had the fewest of any state, at 30,301.
How much does a U.S. passport cost?
A first-time adult passport book costs $130 in State Department fees plus a $35 acceptance facility fee. An adult passport card costs $30 plus $35. Expedited service adds $60.
How long does it take to get a passport?
The Congressional Research Service reports routine processing of 4–6 weeks and expedited processing of 2–3 weeks, not counting mailing time. Times change with demand, so check the State Department's current estimates before you apply.
How often is this page updated?
We review every statistic each quarter and after the State Department publishes each fiscal year's passport data, and update the date at the top of the page whenever figures change.
Sending documents abroad?
Apostilles, notarized passport copies, embassy legalization and certified translations for clients nationwide.